

The Inspection Was Clean. Six Months Later, the Pipe Failed.
Nobody flagged it. The readings looked acceptable. The report was filed, the asset was cleared, and operations continued as normal.
Then, half a year later, a weld seam gave way.
When the investigation team went back through the inspection records, the data was there — scattered across three different report formats, two inspection cycles, and a spreadsheet no one had thought to cross-reference. A pattern of gradual wall thinning. A defect that had been growing quietly, inspection after inspection, in plain sight.
The failure wasn’t caused by bad inspectors. It was caused by disconnected data.
The NDT Industry Has a Data Problem
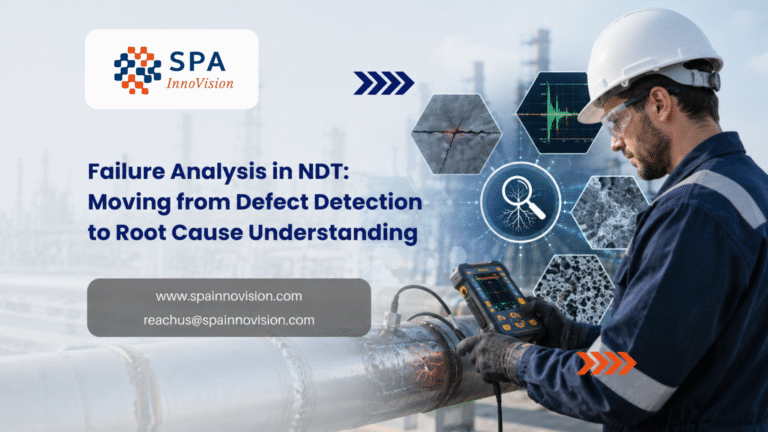
For decades, non-destructive testing has been extraordinarily good at one thing: finding defects. Ultrasonic scans, phased array imaging, radiographic testing, eddy current — the technology behind these methods has advanced dramatically. The resolution is higher. Coverage is faster. Detection sensitivity is better than it’s ever been.
But the data those inspections generate? In many organizations, it still lives in PDFs. In folders organized by date. Individual inspector reports that no one is systematically comparing against last year’s findings — or the asset three bays over with the same failure history.
The tools to find damage have outpaced the tools to understand it. And that gap is where failures hide.
What Changes When Data Becomes Connected
Imagine running an ultrasonic thickness survey on a pressure vessel. The numbers look fine in isolation. But pull up the same vessel’s readings from the past four inspection cycles and suddenly a trend line appears — slow, steady wall loss that, projected forward, puts the asset at minimum thickness in 18 months.
That’s not a new defect. That’s a story the data has been trying to tell for years.
This is what connected failure analysis looks like in practice. When inspection findings are centralized, standardized, and traceable over time, NDT stops being a snapshot and starts being a timeline. Corrosion rates become calculable. Crack propagation becomes predictable. Inspection intervals become defensible — not just based on code requirements, but on actual asset behavior.
Platforms built for this kind of structured failure analysis Failure IQ — exist precisely to close that gap. Instead of siloed reports, teams get a living record of asset health. Instead of reactive callouts, they get early warning signals. Instead of asking what happened, they can start asking what’s going to happen — and act before it does.
The Technology Is Only as Good as the Framework Around It
Phased array UT can produce high-resolution weld images. Automated defect recognition algorithms can flag indications faster than any human reviewer. Digital radiography can be processed and transmitted in minutes.
But none of that matters if the findings aren’t tied to a root cause framework.
A crack indication in a weld means something completely different depending on whether it’s fatigue-driven, caused by hydrogen-induced cracking, or the result of a procedure deviation during fabrication. The NDT data tells you the crack is there. A structured failure analysis tells you why it formed — and whether fixing that weld is enough, or whether every similar weld on the same system needs to be re-examined.
Data without context is just noise. The real power of modern NDT technology comes when inspection data feeds directly into failure analysis workflows — where findings are categorized by mechanism, tracked against operating history, and used to inform risk-based inspection decisions.
That feedback loop — from detection, to analysis, to corrective action, to smarter re-inspection — is what separates organizations that are managing their assets from organizations that are just inspecting them.
The Future Is Already Here — Most Teams Just Aren’t Using It
The NDT industry is sitting on a technology inflection point. Full waveform data storage means every scan is permanently reviewable. AI-assisted analysis is beginning to reduce human interpretation variability. Integration between inspection platforms and asset integrity management systems means that an NDT finding in the field can trigger a maintenance work order, update a risk profile, and flag a re-inspection date — automatically.
The inspectors and engineers who understand not just how to run these technologies, but how to use the data they generate inside a rigorous failure analysis framework, are the ones who will define what modern NDT looks like.
Because the goal was never just to find defects. It was always to understand them — and to use that understanding to make sure the pipe doesn’t fail six months later while the data sits quietly in a folder, waiting for someone to connect the dots.



One Comment
Comments are closed.